
Does your property manager know their own numbers?
If your property manager doesn't know their numbers, the math says you're already losing money. Back in the early 2000s, southeastern Wisconsin property managers operated without accountability. When the housing market downturn hit in 2008, investors were making decisions based on promises rather than data. The challenge was breaking that cycle.
During that time, Jim Miller wasn’t running Performance Asset Management (PAM). Then he was a frustrated investor looking for ways to hold managers accountable, just like with an investor-business relationship. He founded PAM to deliver financial performance to southeastern Wisconsin investors supported by data that they could reliably measure and verify.
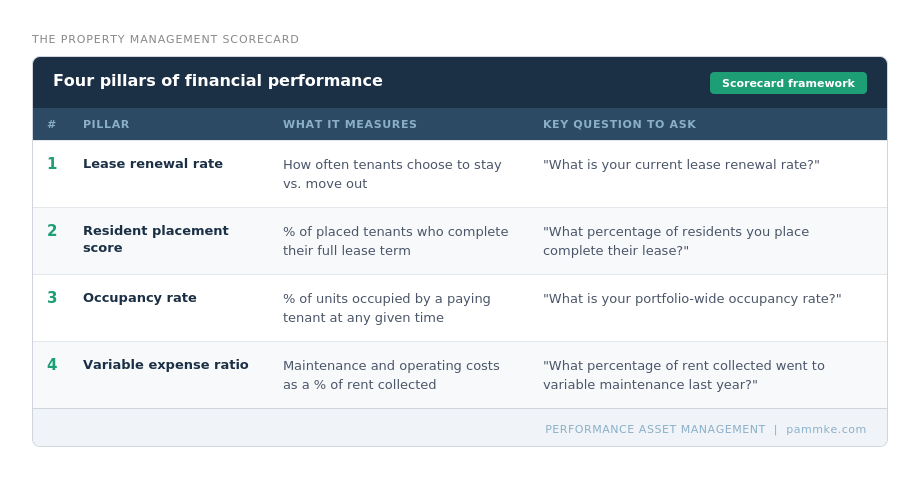
His frustrations trying to confirm whether managers were producing results led to the Property Management Scorecard. Over the past 15 years, this performance-tracking tool has given investors a clearer picture. It consists of four key pillars related to financial performance: lease renewal rate, resident placement score, occupancy rate, and variable expense ratio.
Just like a Carfax report tracks key factors, so can the scorecard. In the same way you wouldn’t buy a car without knowing its history, hiring a manager without knowing their record is a bad idea. Use the scorecard to evaluate property managers, as those who fail to track performance will struggle to improve it. And investors pay the cost when accountability is lacking.
What Is a Lease Renewal Rate, and How Can It Cost Wisconsin Investors Thousands?
A lease renewal rate measures how often tenants choose to renew their lease rather than move out. For Wisconsin investors, low renewal rates can lead to costly vacancies, turnover repairs, leasing fees, and lost rental income, reducing overall returns.
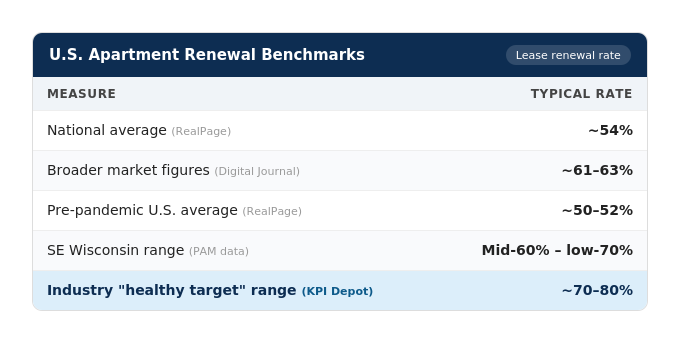
Especially for Milwaukee-area and southeastern Wisconsin investors, lease renewal rates can be one of the strongest indicators of investor financial performance. Currently, industry-wide lease renewal rates in southeastern Wisconsin are in the mid-60% to low-70% range, according to PAM portfolio data spanning more than 15 years and hundreds of Wisconsin units.
If a manager doesn’t know their rates, investors should only expect mean performance within the regional range, based on mathematical certainty. To appreciate lease renewal rates and better understand their significance, consider two property management companies: A (operating at the industry average) and B (a high-performance operator).
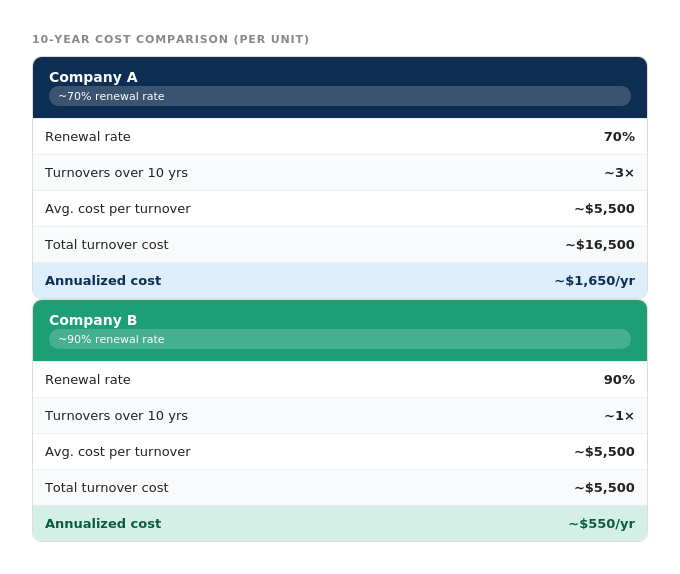
Company A: Operating at the Industry Average (~70% Renewal Rate)
At 70%, turnover happens about 30% of the time.
With an average turnover cost of about $5,000–$5,500, that means:
Total turnover cost: ~$16,500
Annualized cost: ~$1,650 per year
Company B: High-Performance Operator (90% Renewal Rate)
At a 90% renewal rate, turnover drops significantly.
Over the same 10-year period, that results in just 1 turnover.
Total turnover cost: ~$5,500
Annualized cost: ~$550 per year
The Difference
The gap between these two companies is:
~$1,100 per year
~$11,000 over 10 years
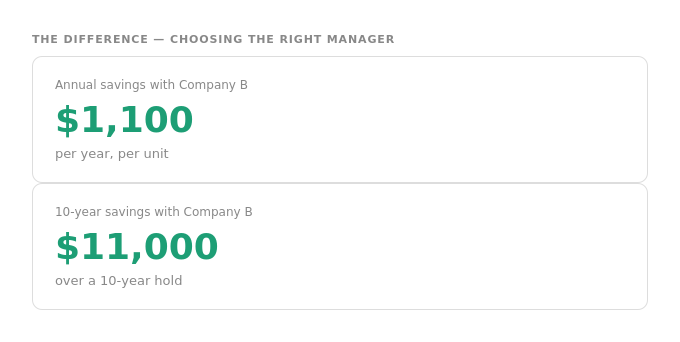
The $1,100 annual gap has nothing to do with management fees, placement fees, or construction costs. In fact, lower lease renewal rates produced that stark gap. Property managers who fail to share those numbers are likely meeting the industry average, costing investors tens of thousands. In the example, that single pillar created an $11,000 per-unit difference over a 10-year hold, an amount that would continue to grow over time.
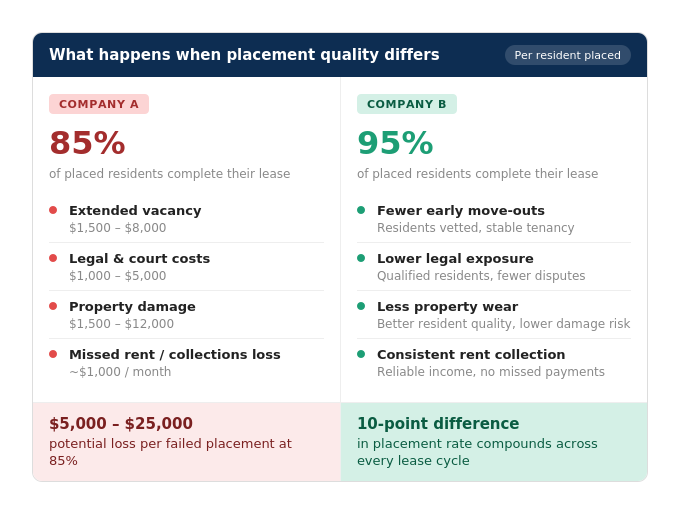
What Is a Resident Placement Score, and How Does It Protect Your Investment?
A resident placement score measures how effectively a property manager places qualified, long-term tenants who pay on time and care for the property. For investors, a strong resident placement process can reduce evictions, property damage, vacancy costs, and lost rental income over time.
Property managers should know what percentage of residents actually complete a full, 12-month lease. Successful investors use these numbers when comparing managers because placement directly impacts investment gains via earnings. The National Bureau of Economic Research has also found that tenant screening practices directly influence leasing outcomes and owner returns.
Even a small difference in placement quality can compound over time, as unexpected turnover leads to higher costs. Think of the amount spent on cleaning and lost rent. And the unit could be returned in poor condition, leading to repairs.
This translates to a simple question: What percentage of residents placed actually complete their lease term? Each new tenant represents risks, as problematic residents can cost:
Extended vacancy: $1,500–$8,000
Legal and court costs: $1,000–$5,000
Property damage: $1,500–$12,000
Missed rent or collections loss: $1,000/month
Poor resident placement can cost owners between $5,000 to $25,000 in losses while creating safety, legal, and neighborhood reputation risks. A manager with a 95% placement success rate poses less risk of capital loss compared to one with an 85% success rate.
Managers who fail to provide their placement score probably neglect tracking it, and investors inherit that problem. High renewal rates and high placement rates can work together, as more renewals could translate to fewer placements needed.
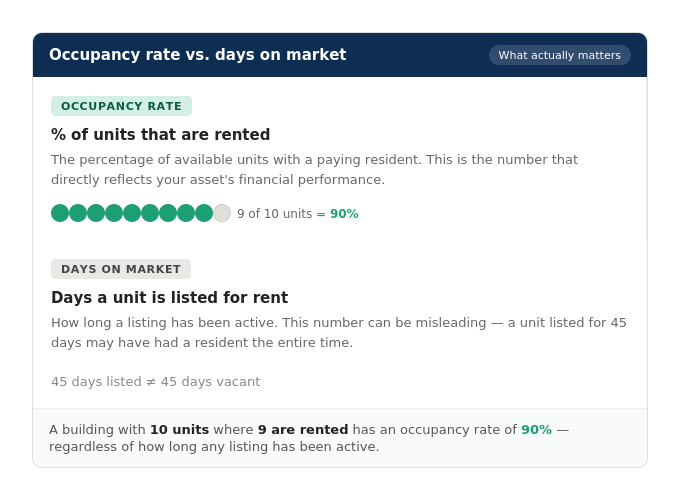
What Is the Difference Between Occupancy Rate and Days on the Market?
Occupancy rate measures how often a rental is filled with paying tenants. Days on the market tracks how long a vacant property takes to lease. Together, these metrics help investors evaluate rental demand, pricing strategy, and efficient property management.
Occupancy rate isolates the number of rent-paying residents per unit, and understanding this metric starts with acknowledging its difference from days on the market.
For example, a building with 10 units where 9 of them are rented has an occupancy rate of 90%.
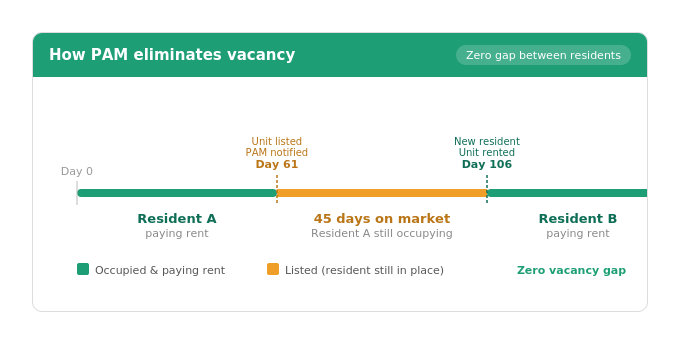
At PAM, we understand not every tenant will renew their lease. So, we reach out 60 days before the lease ends to try to rent it back-to-back. Because the process takes time, we list it early.
An investor might see 45 days on the market, and while that is accurate, tenants were living there during that entire time. Investors are in a stronger position when they understand that placement performance is a better indicator of tenant retention than days on the market.
Even with strong occupancy, deferred maintenance can quietly erode returns, which is exactly what the fourth pillar measures.
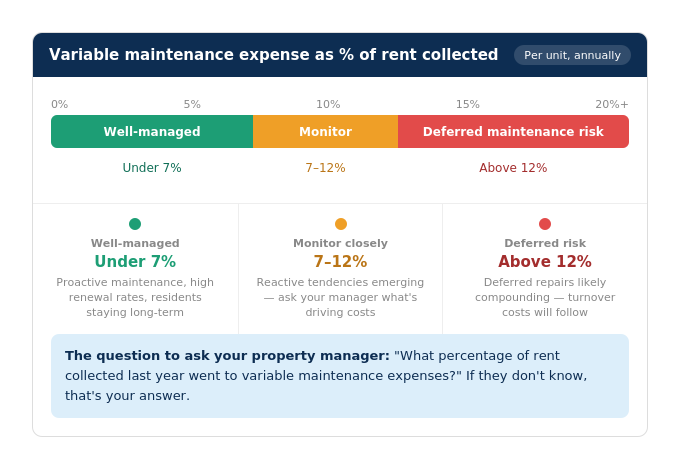
How Does Variable Expense Ratio Reveal Whether a Property Manager Is Costing You Money?
A variable expense ratio measures how much is spent on operating and maintenance costs. For investors, a rising expense ratio may signal inefficient management, unnecessary repairs, or poor cost control, reducing profitability.
How a manager handles maintenance directly impacts how much rental income an investor keeps. Tenant satisfaction frameworks, such as the Institute of Real Estate Management, identify maintenance responsiveness and repair quality as top drivers of satisfaction and lease renewal decisions.
That means poor responsiveness can easily shift repair costs into expensive turnover cycles and vacancy periods. A property collecting $1,500 per month with a 10% variable expense ratio is quietly losing $1,800 annually, which a well-managed property keeps. However, strong maintenance systems can improve investor returns by increasing resident satisfaction.
How Can Investors Use a Property Management Scorecard to Evaluate a Manager in Wisconsin?
Investors can use a property management scorecard to compare performance metrics such as lease renewals, resident placement, occupancy rates, and variable expense ratios to identify whether a manager is improving long-term property performance.
The Property Management Scorecard pillars each have a dollar impact, as the gap between average and high performance is measurable. A manager operating in Wisconsin at a mean renewal rate can cost investors thousands of dollars more each year. The next step for investors is to ask their current property management company for their numbers.
Property managers who fail to provide numbers have given you a valuable and probably expensive answer. Those who can answer with data can be further evaluated based on those benchmarks. PAM was built with the goal of answering these questions for Milwaukee-area and southeastern Wisconsin investors.
High-performing managers should be able to answer all four of these questions with actual numbers. This is the framework we have been using over the past 15 years to evaluate our own performance. Request a Property Manager Scorecard with a walkthrough by an expert to see how PAM measures up against the Wisconsin market mean.